How to use CCI to identify stock price beyond normal range?
What is CCI?
The Commodity Channel Index (CCI) measures whether the stock price is beyond the normal distribution range, it was initially used on commodity market prediction, later being used on stock market.
It is an overbought and oversold type indicator, but it has its own unique features compared with other overbought and oversold indicators. Most of the overbought and oversold indicators like KDJ, WR%, etc. have “0-100” upper and lower limits, they are more suitable for normal market judgement. The CCI indicator fluctuates between positive and negative infinitely, which will help investors judge the market, especially those in the short-term ups and downs beyond the normal range.
How this indicator works?
1.When the CCI indicator breaks through the +100 line from the bottom up and enters the abnormal range, it indicates that the stock price is out of the normal state and enters the abnormal fluctuation stage. The short-term and medium-term should be bought in time. If there is a large transaction volume, the buy signal is even more.
2. When the CCI moves below −100, a new, strong downtrend is beginning, signaling a sell. Use trending indicators such are EMA or other technical analysis methods to confirm signals indicated by the CCI.
3. Look for overbought levels above +100 and oversold levels below -100. These CCI levels can be adjusted depending on the volatility of the security. For example, for a more volatile security you can use +200 and -200. Note:
4.If underlying prices make a new high or low that isn't confirmed by the CCI, the divergence may signal a price reversal. Use the CCI in conjunction with additional indicators such as KDJ, W&R or price analysis when attempting to read overbought or oversold conditions.
How to calculate CCI?
The Commodity Channel Index (CCI) is calculated by determining the difference between the mean price of a security and the average of the means over the period chosen which can be 20 days period, or 14 days or other period. This difference is compared to the average difference over the time period. Comparing the differences of the averages allows for the commodities volatility. The result is multiplied by a constant to ensure that most values fall within the standard range of +/- 100.
CCI = (AveP - SMA_of_AveP) / (0.015 * Mean Deviation)
Where:
CCI = Commodity Channel Index
AveP = Average Price = (High + Low + Close) / 3 (Also known as the Typical Price)
The 0.015 constant ensures 70 to 80 percent of CCI values fall within the +100 to -100 range.
Example of high CCI
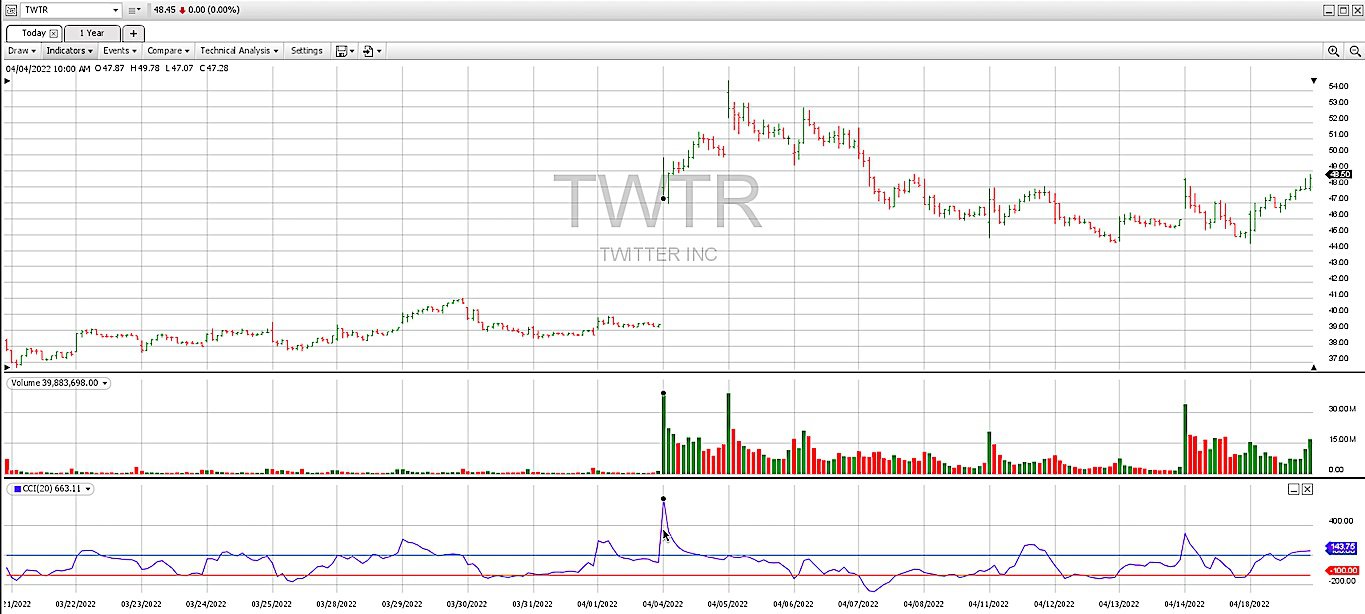
Below is Twitter stock price CCI after Tesla CEO Elon Musk claimed owned 9% on April 4th
From above chart, we can find out that CCI jumped up to 663, which was far above its noraml range, the trading volume signal is very strong, the green color indicated it is the strong buying market, the stock price jumped from 39 to 49.
The strong sign of buying market.
