How to use DMI to interpret stock price movement?
Case Study: Game Stop
What is DMI?
The Directional Movement Index (DMI) assists in determining if a security is trending and attempts to measure the strength of the trend.
The indicator is made up of four indicator lines:
Plus Directional Indicator (PDI+) shows the difference between today’s high price and yesterday’s high price. These values are then added up from the past 14 periods and then plotted.
Minus Directional Indicator (MDI-) shows the difference between today’s low price and yesterday’s low price. These values are then summed up from the past 14 periods and plotted.
Average Directional Movement Index (ADX). ADX is a smoothing of the DX.
Average Directional Movement Index Rating (ADXR) is a simple average of today’s ADX value and the ADX from 14 periods ago.
How to use DMI indicators?
1.PDI+ is the rising direction indicator. The higher the PDI value, the strong rising trend;
MDI- is the falling direction indicator. The higher the MDI- value, the strong weak trend.
2.When the PDI+ line breaks from the bottom to the top of the MDI- line, when the two lines cross, it is the signal to buy.
If the ADX line rises again, the gain is stronger. As the stock price rises, the PDI+ line will climb upwards, indicating an increase in the upside momentum, and the MDI- line will fall, reflecting the weakening of the downward momentum.
3.The PDI+ line falls from the top to the bottom of the MDI- line. When the two lines cross, it is the signal of sale. If the ADX line goes up again, the downtrend is even more fierce.
4.ADX is a trend momentum indicator. During the period of obvious uptrend or downtrend, the ADX line will gradually increase, and the strength representing the rise or fall has increased.
Therefore, if ADX is often in a low-end situation, it indicates that the market is in a weak market with weak growth; if ADX is often in high-end, it represents a market that is more favorable.
5.The PDI+ line and the MDI -line are often close to or even entangled. At this time, if the ADX value is also downwards and below 20, the market is in a consolidation stage, and it is not the time to profit out of investment.
6.When the stock price reaches its peak or bottom, ADX will reverse after reaching its highest point before and after. When ADX moves from rising to falling, the market is about to reverse.
In the uptrend, ADX turned from low to high, indicating that the rally is coming to an end; on the contrary, in the downtrend, ADX also turned from high to low, and also said that the decline will end.
7. Typically if the ADX is above 25 it indicates a strong trend. Typically if the ADX is below 20 it indicates a trend less market.
Case Study: Game Stop stock analysis
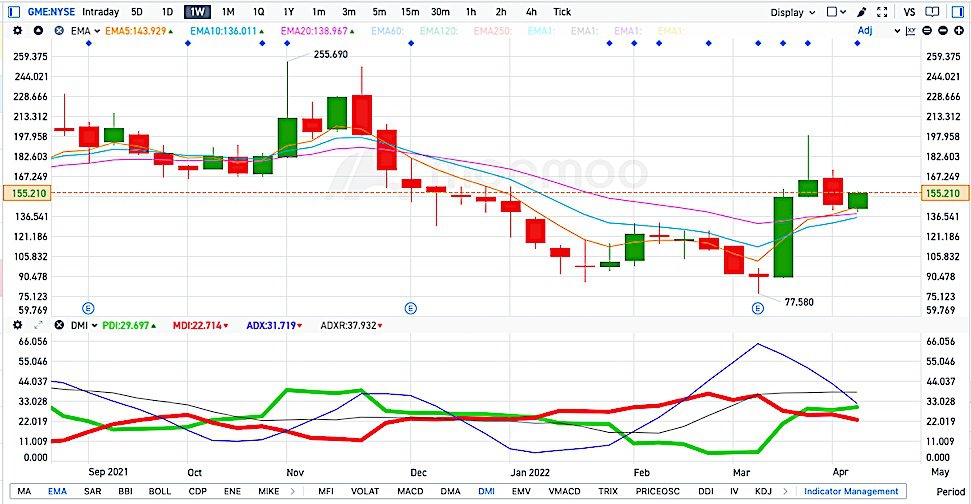
Below is the chart extracted from moomoo app
The two thick line represents DMI (Green and Red) PDI, MDI respectively, what we can find out
- PDI+ is the rising direction indicator, the MDI- is the falling direction indicator, this tells us that there could be strong the rising trend;
-
PDI+ line breaks from the bottom to the top of the MDI- line, this tells us that when the two cross, it is the signal to buy;
-
ADX is above 25, this indicates that the trend is strong
-
ADX moving direction opposits to stock price moving direction, this indicates to buy
Based upon DMI analysis, Game Stop stock price is predicted to go up, however any stock purchase decision should not be based upon one indicator, investors should review other indicators, including MA, RSI. etc.
