Which indicator should I use, WMA, EMA or VAMA?
We often received questions, as a trader, which trend indicator should I use, is there a magic indicator?
So Weighted Moving Average (WMA), Exponential Moving Average (EMA), Volume Adjusted Moving Average (VAMA), which one is better?
The answer depends more on whether you are active day trader or mid term trader, if you are an active day trader, meaning you trade within 5 days, you should be attention to WMA more carefully, why? WMA put more weight on recent stock price, which makes WMA more sensitive to recent stock price.
Also keep in mind beside the trading price, the trading volume could play very important role to impact the stock price movement, it could define stock movement momentum. If you noticed suddenly certain stock is trading actively, the trading volume increase dramatically, meaning something dramatically happened, could be breaking news released on the market, these news could be company quarterly report, war, pandemic, etc.
Here is the sample, below charts demonstrates the trading volume movement after Elon Musk announce to own 9 percent Twitter stock.

The trading volume jumped suddently, so does stock price, the price gap from $39 to $49.
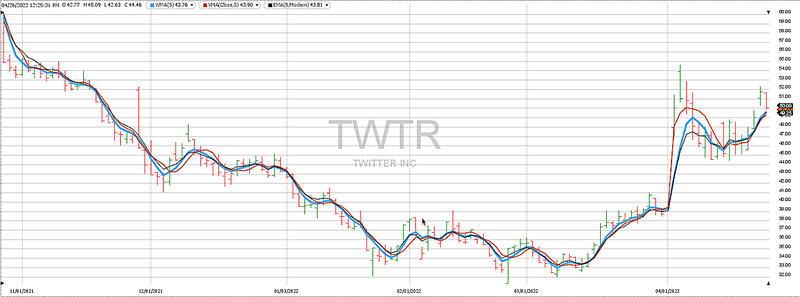
Let’s take a look at below chart, Twitter stock price movement by comparing EMA, WMA, VAMA on short term

On the above chart, red line represents VAMA, blue line represents WMA, black line reprents EMA, all these lines is 5 days period, VAMA best presented the price movement reality, for short term active trader, trading volume is a must considering factor, also most recent price also play very important role on short term trading.
Bearing in mind, stock trading, regarding when to buy, when to sale, is technical data movement, also art work, Why? behind stock price, we are all human being, who are trading.