moomoo Advanced Charting Tools
moomoo trading platform offers 62 technical indicators and 37 drawing tools, these charts include financial indicators and technical indicators, including historical K-line, moving average, multiple stocks comparison, as a matter of factor, you can draw your own charts.
Let's use Tesla as example to illustrate how powerful moomoo Charting Tools.
After you Log In moomoo app
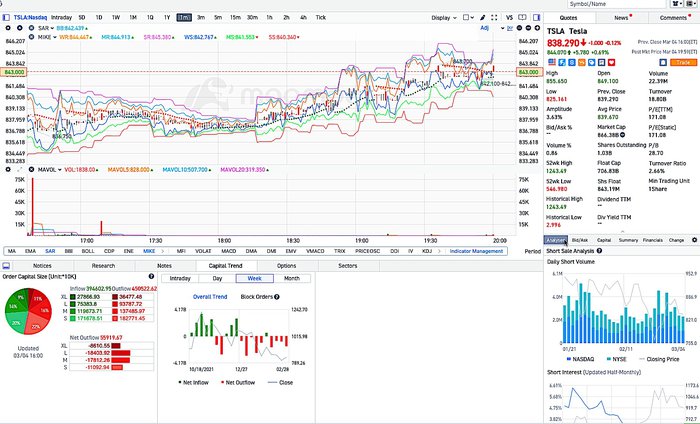
Click Watch Lists, and click Tesla, you will see image as below
It is overwhelming, however if you break them into pieces, the information is very powerful and handy.
Stock Price Section
(Top Left part)
It demonstrate Tesla stock price change, you can choose to view them by day, week, month, quarter, year. If you are active trader, you can view stock price change by minute, 30 minutes, 1 hour and ticket.
Click 1m, you can view stock price change by minute.
(Refer below)
At the bottom of this section, lists many stock performance indicators, for example MA, SAR etc. You can view one indicator by click one or you can click multipe indicators by simplly click them. The above chart show MA (Moving Average) chart. Different days of moving average is marketd in different color. MA5, 5 days moving average, in Orange; MA10, 10 das moving average in light blue, MA20, 20 days moving average, in purple, MA30, 30 days moving average, in dark blue.
Quotes Section
(Top Right Part)
Quote presents Tesla Stock in a big picture, including trading price, volume, 52wk Low/High, PE ratiao, outstanding shares, market cap. It gives investors general idea about Tesla stock.
Capital Trend Section
(Low left part)
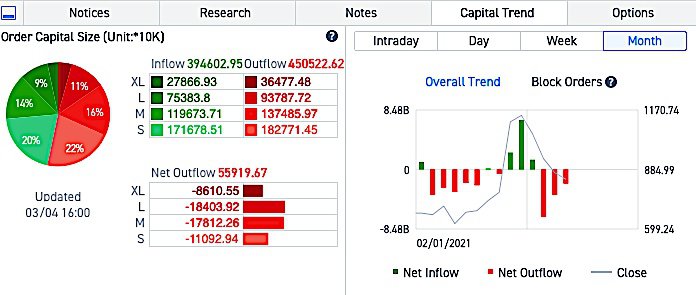
Capital Trend illustrates Capital inflow, outflow and net flow. Under each capital flow, it breaks down to XL, L, M, S (extra large, large, medium, small captial), it illustrates capital flow during the day (intraday), by day, week and month. By reading capital trend, investors get basic ideas about Tesla stock capital flow direction, especially large capital flow direction.
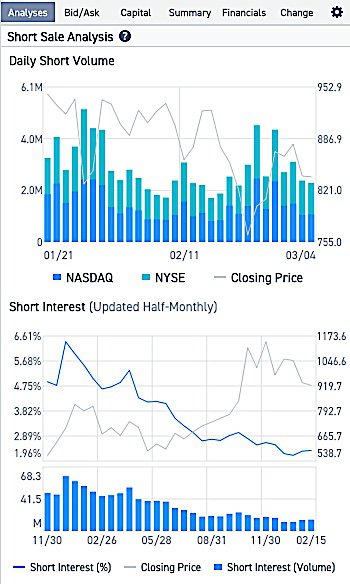
Short Sale Section
(lower right part)
Bid/Ask Section
Financials Section
In Financial section illustrates Tesla financial situation, including income statement, balance sheet, cash flow, it also lists key financial indicators, such as EPS (Earnings per share), ROE (Return on Equity), etc. it gives actual value and predicted value. By reading financial information, investors get a basic idea whether Tesla is making profit or now.
Option Section
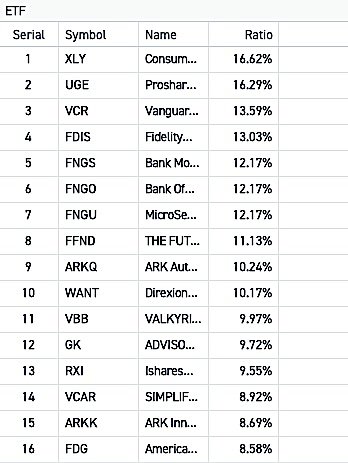
ETF Section
