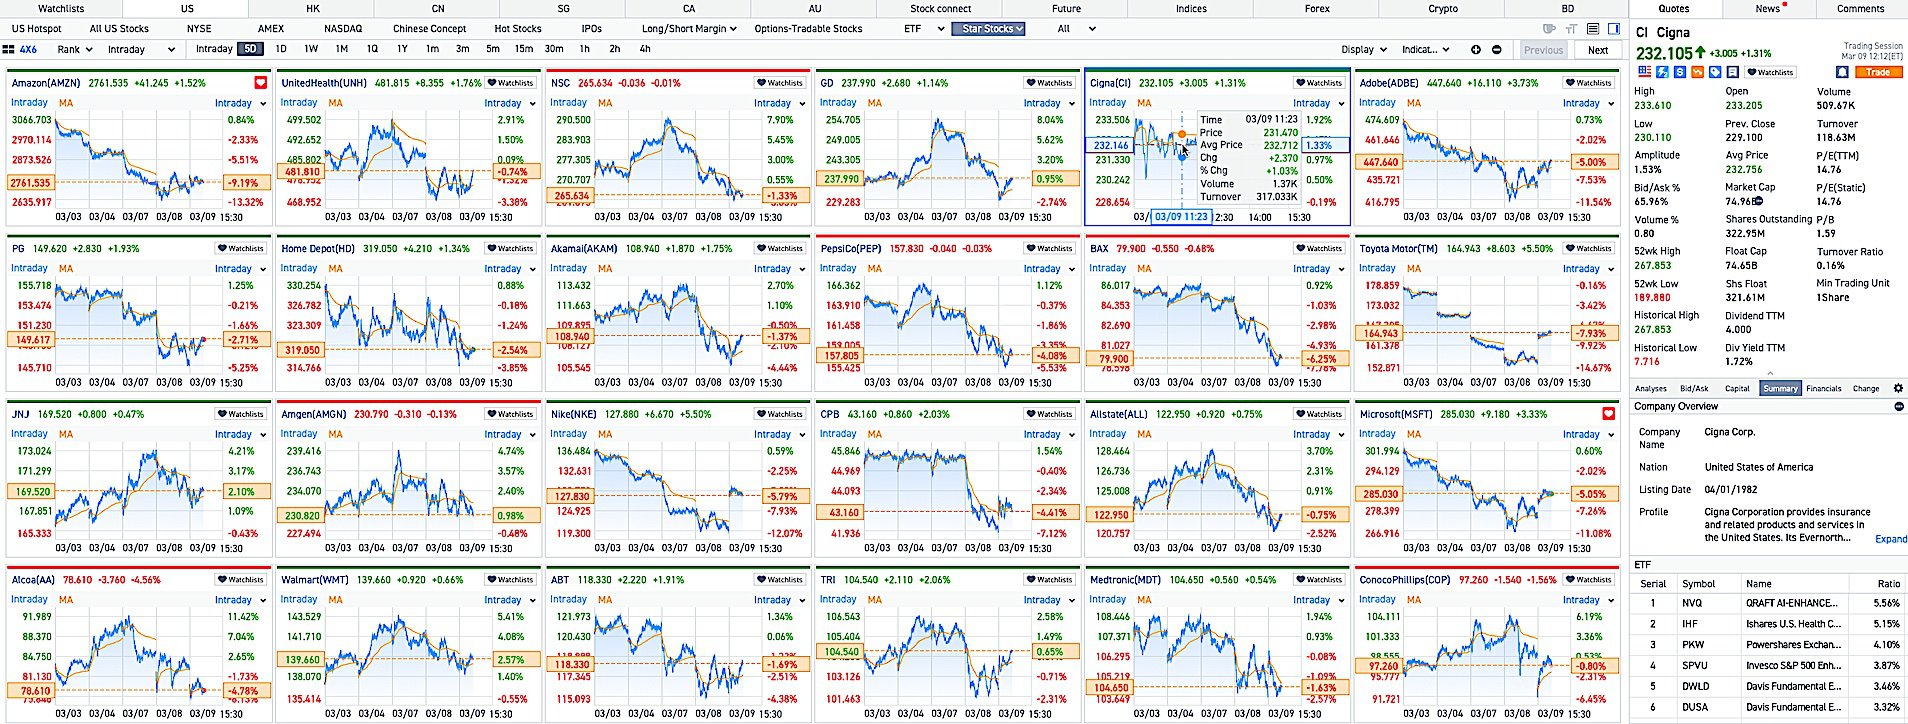
Multiple Stocks Comparison Screen
moomoo futu mutiple stocks comparison screen, whicll allows investors to view mutiple stocks at a glance.
The stock comparison function can be vividly called the individual stock physical examination table.
This tool is unique for stock selection, and very powerful tools, it provides 100+ indicators for 3 markets. These indicators include stock price related indicators, such as high/low, average, moving avarage, etc. company fundamental indicators, such as ROE, market cap, PE ratio, earings per share, cash flow etc. This tool can display stock inforamtion from mutiple dimentions, and its is updated on time.
Below is moomoo futu multiple stock comparison example
